Difference between revisions of "Live Data"
| (25 intermediate revisions by the same user not shown) | |||
| Line 1: | Line 1: | ||
| − | + | Live data tab decomposes into sub tabs showing the upload status of weather network feeds and individual push services, the current raw sensor data as coming in, and a sub tab showing the min/max values for today, thi smonth, this year and all time. | |
| − | + | =Upload Status= | |
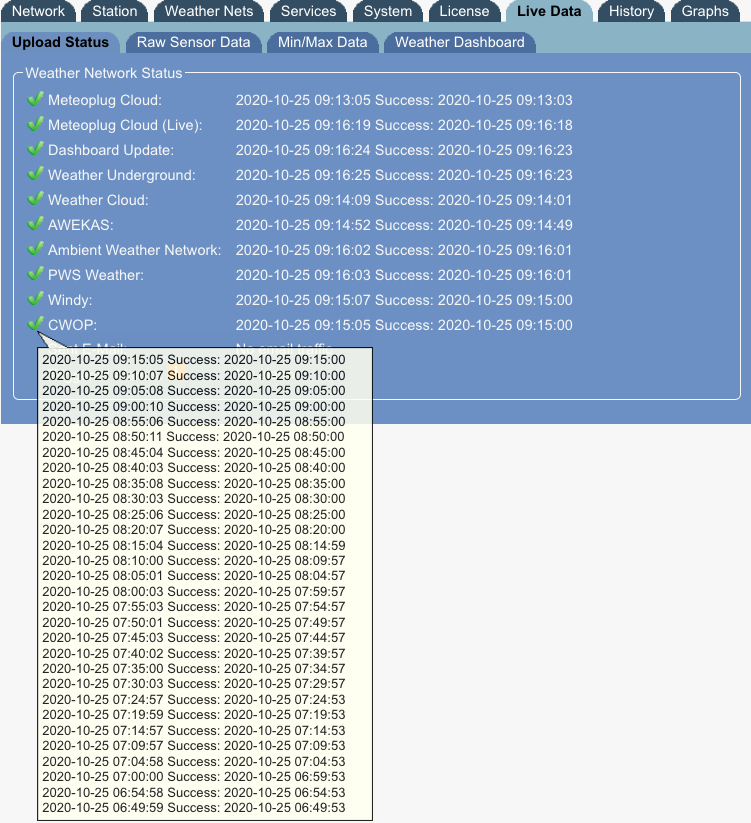
| + | Status field displays date and time of last upload to selected weather networks and activated push services. Notification includes information, if upload was successful. In case of a successful upload you find a green mark, if it did fail you see a red mark and an error description. | ||
| − | + | When you move the mouse over an event's checkmark, you get a bit of an event history. | |
| − | + | ||
| − | + | [[File:page5x1.png]] | |
| − | + | ||
| − | = | + | =Raw Sensor Data= |
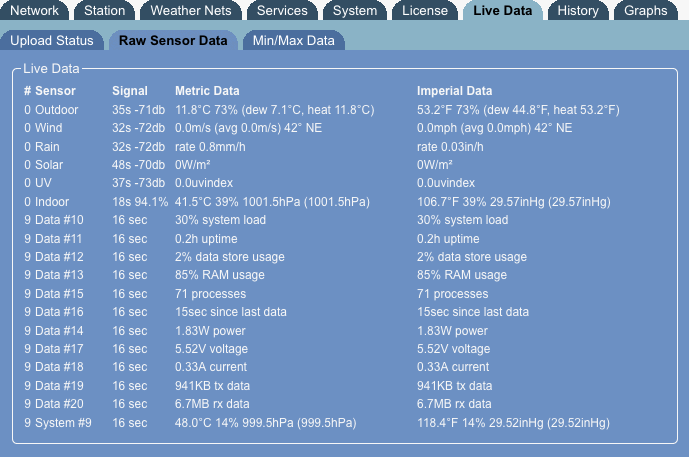
| − | Meteobridge also keeps track of some historical data like min/max values of the day, month, year. As this information | + | This section shows current measurements of all sensors Meteobridge has received data for. "Signal" column displays how much time has passed since the last update of the sensor. In case of Meteostick or Meteobridge PRO with RF also the signal level in db is displayed and barometer sensor also reports percentage of correctly received packets. Measurements are given in metric units and imperial units in parallel. A low battery symbol at the end indicates that battery power of the sensor is towards a critical level. Please inspect your weather station's console to decide if batteries need to be replaced or not, Meteobridge just works with rough estimates on this. |
| + | |||
| + | [[File:page5x2.png]] | ||
| + | |||
| + | =Min/Max Data= | ||
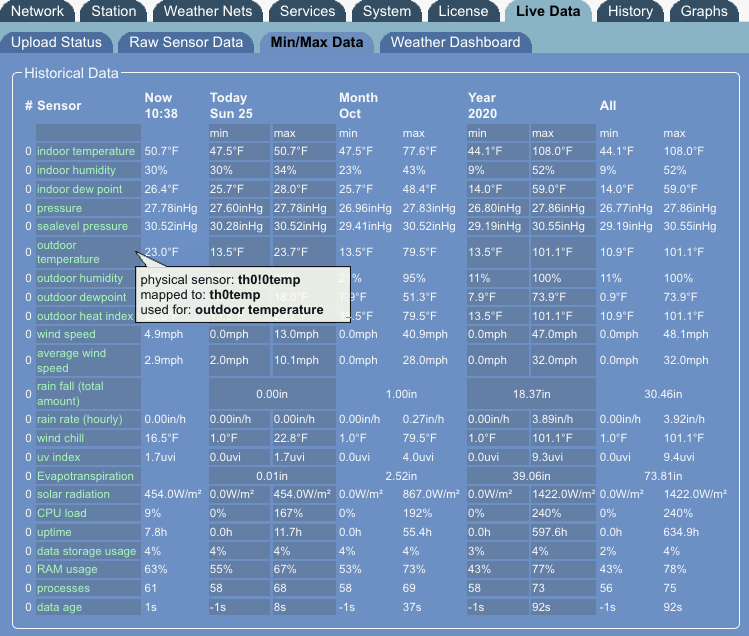
| + | Meteobridge also keeps track of some historical data like min/max values of the day, month, year and all time. As this information would be lost during a powercycle or reboot, Meteobridge does store this information on the Meteobridge Internet server in regular intervals. After a restart of your Meteobridge devices data is restored from there so that statistics have a chance to be correct even over a longer time period. | ||
| + | |||
| + | [[File:page5x3.png]] | ||
| + | |||
| + | When you move your mouse over historical data a balloon help will show up, which reports time stamp of selected minimum or maximum. When you click into the field, a dialog will pop-up which allows you to change historical values. Current values will be displayed in metric and imperial units. When you input data, you can use metric units (default when no unit is specified) or imperial units ("F", "inhg", "in", "mph"), which needs the unit to be added after the digits. Please only use one type of units, don't type in both values. A missing unit will be computed automatically. Beside values you can also change the timestamp, when the min/max event has occured. You simply do that by adding a "@yyyy-mm-dd HH:MM" string to the value. You can state the full date or just hours and minutes ("HH:MM"). Separation of numeric fields inside the datestamp you can use any non-digit character. Sequence from the end must be: minutes, hour, day, month, year. | ||
| + | When you finally save changes, display will be refreshed and shows data you have updated. | ||
| + | |||
| + | When you hover your mouse over the sensor name, you will be presented the physical sensor name, its mapping to a logical sensor and what the meaning of this logical sensor is in terms of uploading data. | ||
| + | |||
| + | When you are on a Meteobridge PRO or NANO SD clicking onto a value will direct you to an page where you can enter hourly data manually and by that correct values which yo don't feel are right. | ||
| + | |||
| + | Color of sensor names on the left side does indicate if sensor is used for reporting of weather data to weather networks: | ||
| + | * <b>green</b>: Sensor is mapped to a meaningful logical sensor name by default and used for weather network reporting. | ||
| + | * <b>yellow</b>: Sensor is mapped to a meaningful logical sensor name by a manual mapping entry on "station -> mapping" tab and is used for reporting to weather networks. | ||
| + | * <b>white</b>: Sensor is not used for weather network reporting because of a certain mapping on "station -> mapping" tab or is providing data that the weather networks don't make use of. | ||
| + | |||
| + | When a trash can icon appears in "Now" column, you can delete the historical data of a specific sensor by clicking onto the trash can. Meteobridge will pop-up a confirmation dialog to make sure you are not deleting historical data by accident. Historical data for sensors currently delivering data cannot be deleted, which by the way would not make too much sense, as the data coming in on this sensor will immediately start building up historical data from scratch again. | ||
| + | |||
| + | "Erase" button gives you the option to get rid of all historical data. Before data is deleted a pop-up dialog appears to make sure you really want to erase your historical data. ON Meteobridge PRO and NANO SD the button is not present. Data editiong is realized on a separate "History" tab. | ||
Latest revision as of 18:48, 25 October 2020
Live data tab decomposes into sub tabs showing the upload status of weather network feeds and individual push services, the current raw sensor data as coming in, and a sub tab showing the min/max values for today, thi smonth, this year and all time.
Upload Status
Status field displays date and time of last upload to selected weather networks and activated push services. Notification includes information, if upload was successful. In case of a successful upload you find a green mark, if it did fail you see a red mark and an error description.
When you move the mouse over an event's checkmark, you get a bit of an event history.
Raw Sensor Data
This section shows current measurements of all sensors Meteobridge has received data for. "Signal" column displays how much time has passed since the last update of the sensor. In case of Meteostick or Meteobridge PRO with RF also the signal level in db is displayed and barometer sensor also reports percentage of correctly received packets. Measurements are given in metric units and imperial units in parallel. A low battery symbol at the end indicates that battery power of the sensor is towards a critical level. Please inspect your weather station's console to decide if batteries need to be replaced or not, Meteobridge just works with rough estimates on this.
Min/Max Data
Meteobridge also keeps track of some historical data like min/max values of the day, month, year and all time. As this information would be lost during a powercycle or reboot, Meteobridge does store this information on the Meteobridge Internet server in regular intervals. After a restart of your Meteobridge devices data is restored from there so that statistics have a chance to be correct even over a longer time period.
When you move your mouse over historical data a balloon help will show up, which reports time stamp of selected minimum or maximum. When you click into the field, a dialog will pop-up which allows you to change historical values. Current values will be displayed in metric and imperial units. When you input data, you can use metric units (default when no unit is specified) or imperial units ("F", "inhg", "in", "mph"), which needs the unit to be added after the digits. Please only use one type of units, don't type in both values. A missing unit will be computed automatically. Beside values you can also change the timestamp, when the min/max event has occured. You simply do that by adding a "@yyyy-mm-dd HH:MM" string to the value. You can state the full date or just hours and minutes ("HH:MM"). Separation of numeric fields inside the datestamp you can use any non-digit character. Sequence from the end must be: minutes, hour, day, month, year. When you finally save changes, display will be refreshed and shows data you have updated.
When you hover your mouse over the sensor name, you will be presented the physical sensor name, its mapping to a logical sensor and what the meaning of this logical sensor is in terms of uploading data.
When you are on a Meteobridge PRO or NANO SD clicking onto a value will direct you to an page where you can enter hourly data manually and by that correct values which yo don't feel are right.
Color of sensor names on the left side does indicate if sensor is used for reporting of weather data to weather networks:
- green: Sensor is mapped to a meaningful logical sensor name by default and used for weather network reporting.
- yellow: Sensor is mapped to a meaningful logical sensor name by a manual mapping entry on "station -> mapping" tab and is used for reporting to weather networks.
- white: Sensor is not used for weather network reporting because of a certain mapping on "station -> mapping" tab or is providing data that the weather networks don't make use of.
When a trash can icon appears in "Now" column, you can delete the historical data of a specific sensor by clicking onto the trash can. Meteobridge will pop-up a confirmation dialog to make sure you are not deleting historical data by accident. Historical data for sensors currently delivering data cannot be deleted, which by the way would not make too much sense, as the data coming in on this sensor will immediately start building up historical data from scratch again.
"Erase" button gives you the option to get rid of all historical data. Before data is deleted a pop-up dialog appears to make sure you really want to erase your historical data. ON Meteobridge PRO and NANO SD the button is not present. Data editiong is realized on a separate "History" tab.


